DEFR14A: Definitive revised proxy soliciting materials
Published on October 13, 2023
UNITED STATES
SECURITIES AND EXCHANGE COMMISSION
Washington, D.C. 20549
SCHEDULE 14A
(Amendment No. 1)
Proxy Statement Pursuant to Section 14(a) of the Securities Exchange Act of 1934
Filed by the Registrant x
Filed by a Party other than the Registrant o
Check the appropriate box:
| o | Preliminary Proxy Statement | o | Confidential, for Use of the Commission Only (as permitted by Rule 14a-6(e)(2)) | |||||||||||
| o | Definitive Proxy Statement | |||||||||||||
| x | Definitive Additional Materials | |||||||||||||
| o | Soliciting Material Pursuant to § 240.14A-12 | |||||||||||||

| (Name of Registrant as Specified in its Charter) | ||
| (Name of Person(s) Filing Proxy Statement, if other than the Registrant) | ||
| Payment of Filing Fee (Check all boxes that apply): | |||||
| x | No fee required. | ||||
| o | Fee paid previously with preliminary materials. | ||||
| o | Fee computed on table in exhibit required by Item 25(b) per Exchange Act Rules 14a-6(i)(1) and 0-11. |
||||
EXPLANATORY NOTE
This amendment to the proxy statement of ResMed Inc. filed on October 5, 2023 (the "Proxy Statement") amends the Pay vs Performance section of the Proxy Statement solely for the purpose of including the required Inline XBRL tagging, as the Proxy Statement inadvertently did not have complete XBRL tagging. There are no other changes to the Pay vs Performance section, or or any other portion of, the Proxy Statement.
Pay versus Performance
In accordance with Item 402(v) of Regulation S-K, we are providing the following information regarding the relationship between “compensation actually paid” to our CEO, or Principal Executive Officer (PEO), and our other named executive officers (Non-PEO NEOs) and certain financial performance measures for the fiscal years ended on June 30, 2023, June 30, 2022, and June 30, 2021. For further information on ResMed's pay-for-performance philosophy and how executive compensation aligns with Company performance, refer to the above section entitled “Compensation Discussion & Analysis” (“CD&A”).
| Fiscal Year |
Summary Compensation Table Total for PEO (1) |
Compensation Actually Paid to PEO (2) |
Average Summary Compensation Table Total for non-PEO NEOs (3) |
Average Compensation Actually Paid to non-PEO NEOs (4) |
Value of Initial Fixed $100 Investment Based On: |
Net Income ($M) |
Adjusted Net Sales ($M) (6) |
|||||||||||||||||||
| RMD Total Shareholder Return |
Dow Jones US Med. Equipment Total Shareholder Return (5) |
|||||||||||||||||||||||||
| 2023 | $ |
$ |
$ |
$ |
$ |
$ |
$ |
$ |
||||||||||||||||||
| 2022 | $ |
$ |
$ |
-$ |
$ |
$ |
$ |
$ |
||||||||||||||||||
| 2021 | $ |
$ |
$ |
$ |
$ |
$ |
$ |
$ |
||||||||||||||||||
1.ResMed had one Principal Executive Officer or “PEO”, Mr. Michael Farrell , during fiscal years 2023, 2022, and 2021.
2.SEC rules require certain adjustments be made to the “Total” column as reported in the Summary Compensation Table to determine “Compensation Actually Paid” as reported in the Pay versus Performance Table (“PVP Table”). “Compensation Actually Paid” does not necessarily represent cash and/or equity value transferred to the applicable NEO without restriction, but rather is a value calculated under applicable SEC rules. The equity values are calculated in accordance with ASC Topic 718, with dividends being reflected in the fair value of the award. Valuation assumptions used to calculate fair values used a consistent process as done on the date of grant and were not materially different from those disclosed at the time of grant. The closing stock price of our common stock on June 30, 2020, June 30, 2021, June 30, 2022, and June 30, 2023, was $192.00, $246.52, $209.63 and $218.50. The following tables detail these adjustments for the PEO:
| PEO | |||||||||||
| Prior FYE | 6/30/2020 | 6/30/2021 | 6/30/2022 | ||||||||
| Current FYE | 6/30/2021 | 6/30/2022 | 6/30/2023 | ||||||||
| Fiscal Year | 2021 | 2022 | 2023 | ||||||||
| Summary Compensation Table Total | $ | $ | $ | ||||||||
| - Grant Date Fair Value of Option Awards and Stock Awards Granted in Fiscal Year | $ | ( |
$ | ( |
$ | ( |
|||||
| + Fair Value at Fiscal Year-End of Outstanding and Unvested Option Awards and Stock Awards Granted in Fiscal Year | $ | $ | $ | ||||||||
| + Change in Fair Value of Outstanding and Unvested Option Awards and Stock Awards Granted in Prior Fiscal Years | $ | $ | ( |
$ | ( |
||||||
| + Fair Value at Vesting of Option Awards and Stock Awards Granted in Fiscal Year That Vested During Fiscal Year | $ | $ | $ | ||||||||
| + Change in Fair Value as of Vesting Date of Option Awards and Stock Awards Granted in Prior Fiscal Years For Which Applicable Vesting Conditions Were Satisfied During Fiscal Year | $ | $ | $ | ||||||||
| - Fair Value as of Prior Fiscal Year-End of Option Awards and Stock Awards Granted in Prior Fiscal Years That Failed to Meet Applicable Vesting Conditions During Fiscal Year | $ | $ | $ | ||||||||
| Total Adjustments | $ | $ | ( |
$ | |||||||
| Compensation Actually Paid | $ | $ | $ | ||||||||
3. Non-PEO NEOs included for the fiscal years 2023, 2022 and 2021 are reflected in the table below:
| Fiscal Year | Non-PEO NEOs | ||||
| 2023 | Lucile Blaise, Rob Douglas, Bobby Ghoshal, Brett Sandercock | ||||
| 2022 | Rob Douglas, Bobby Ghoshal, Jim Hollingshead, David Pendarvis, Brett Sandercock | ||||
| 2021 | Rob Douglas, Jim Hollingshead, Brett Sandercock, Raj Sodhi | ||||
4. As discussed in footnote 2, SEC rules require certain adjustments to be made to determine “compensation actually paid” as reported in the Pay versus Performance table above. The following table details these adjustments to the Average Summary Compensation Table Total for Non-PEO NEOs.
| Average of Non-PEO NEOs | |||||||||||
| Prior FYE | 6/30/2020 | 6/30/2021 | 6/30/2022 | ||||||||
| Current FYE | 6/30/2021 | 6/30/2022 | 6/30/2023 | ||||||||
| Fiscal Year | 2021 | 2022 | 2023 | ||||||||
| Summary Compensation Table Total | $ | $ | $ | ||||||||
| - Grant Date Fair Value of Option Awards and Stock Awards Granted in Fiscal Year | $ | ( |
$ | ( |
$ | ( |
|||||
| + Fair Value at Fiscal Year-End of Outstanding and Unvested Option Awards and Stock Awards Granted in Fiscal Year | $ | $ | $ | ||||||||
| + Change in Fair Value of Outstanding and Unvested Option Awards and Stock Awards Granted in Prior Fiscal Years | $ | $ | ( |
$ | ( |
||||||
| + Fair Value at Vesting of Option Awards and Stock Awards Granted in Fiscal Year That Vested During Fiscal Year | $ | $ | $ | ||||||||
| + Change in Fair Value as of Vesting Date of Option Awards and Stock Awards Granted in Prior Fiscal Years For Which Applicable Vesting Conditions Were Satisfied During Fiscal Year | $ | $ | $ | ||||||||
| - Fair Value as of Prior Fiscal Year-End of Option Awards and Stock Awards Granted in Prior Fiscal Years That Failed to Meet Applicable Vesting Conditions During Fiscal Year | $ | $ | ( |
$ | |||||||
| Total Adjustments | $ | $ | ( |
$ | |||||||
| Compensation Actually Paid | $ | $ | ( |
$ | |||||||
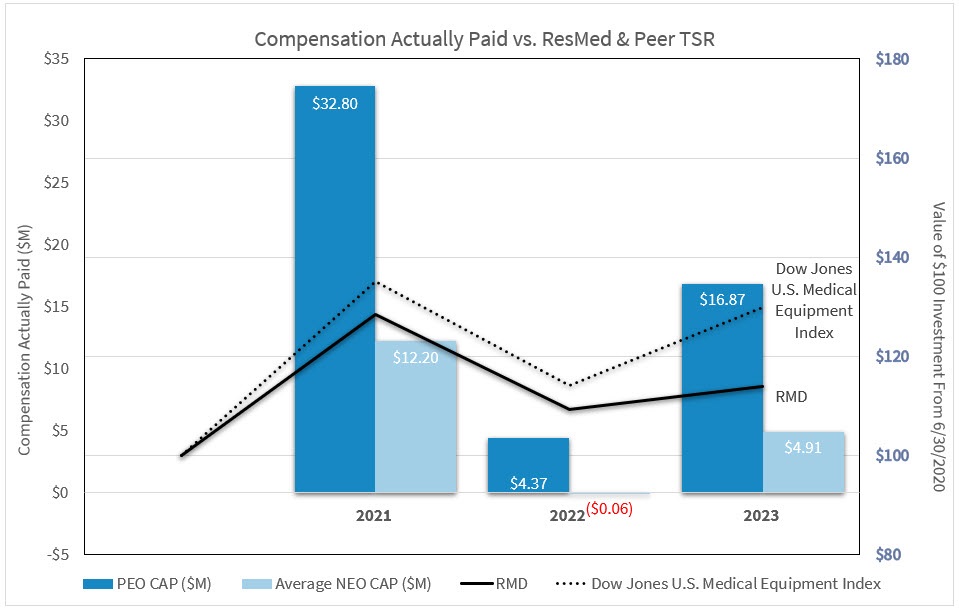
5. The Dow Jones U.S. Medical Equipment index is one of the two index peer groups disclosed in our 10-K and we selected this index as our peer group for purposes of this disclosure, which is comprised of 61 companies from the Dow Jones U.S. Broad Stock Market Index that are classified in the DJICS Medical Equipment subsection. The Company’s fiscal 2023 performance-based long-term incentive program did not use this relative TSR as a financial performance measure. See the CD&A section titled “Long Term Incentives” in this Proxy Statement for additional information.
6. Adjusted Net Sales represents the most important financial performance measure (that is not otherwise required to be disclosed in the table) used by the Company to link compensation actually paid to our NEOs, including our CEO, for the most recently completed fiscal year to the Company’s performance. Adjusted Net Sales is a non-GAAP measure and is calculated as net sales on a GAAP basis excluding the impact of revenue from acquisitions completed after the establishment of the internal financial plan, as applicable, and foreign currency fluctuations. For a reconciliation of Adjusted Net Sales to the most directly comparable GAAP financial measure and insight into how Adjusted Net Sales is considered by management, please see Page 56 under "Elements of Compensation - Annual Cash Incentive Plan - Incentive Plan Adjustments."
Analysis of the Information Presented in the Pay versus Performance Table
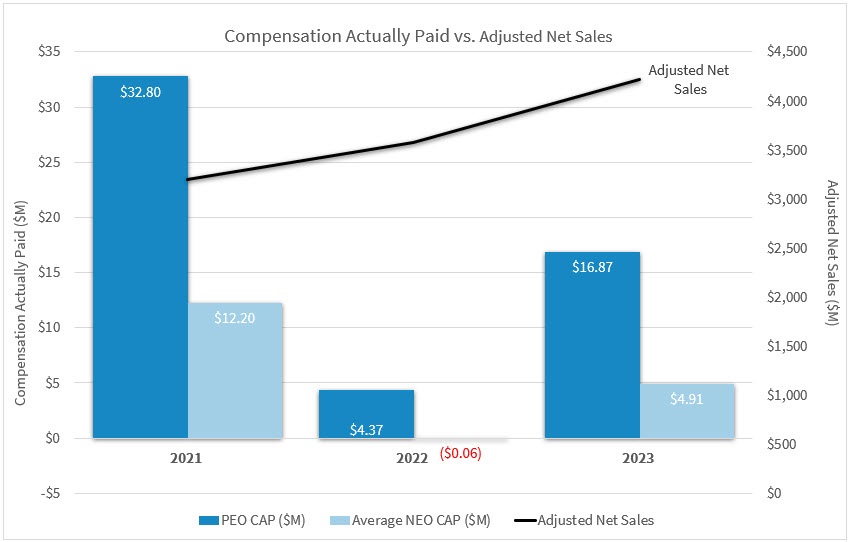
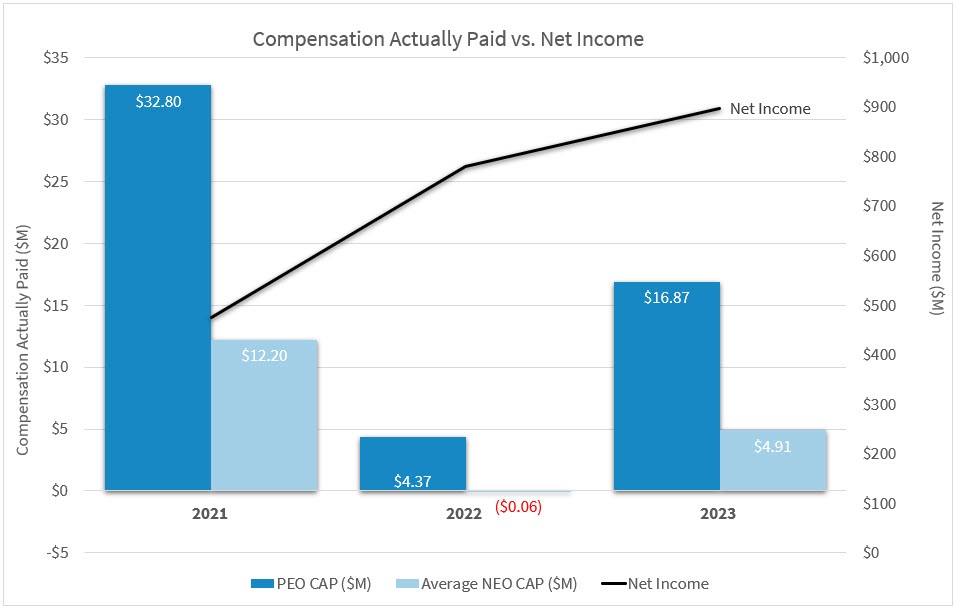
In this section, we provide a graphic analysis showing, for the past three years, the relationship between our PEO’s and the Average of the Non-PEO NEOs’ “Compensation Actually Paid” and (i) the Company’s Adjusted Net Sales, (ii) the Company’s Net Income and (iii) the Company’s TSR, and additionally, the TSR of the Dow Jones U.S. Medical Equipment Index, one of the disclosed peer groups from our 10-K filing. As described in more detail in the CD&A, our executive compensation program reflects a pay-for-performance philosophy that emphasizes long-term equity awards intended to align our executives’ interests with stockholders’ long-term interests. Thus, the value of these awards and, therefore, a large portion of the compensation actual paid to our NEOs is inherently correlated to the Company’s stock price over time. Please refer to the section entitled CD&A above for more information about our executive compensation program.


Tabular list of Financial Performance Measures
The Company’s Compensation Committee believes in a holistic evaluation of our NEOs, and the Company’s performance measures throughout our annual focal and long-term incentive compensation programs to align executive pay with Company performance. As required by SEC rules, the performance measures are identified as the most important used to link the “Compensation Actually Paid” to our NEOs for fiscal 2023 compensation to the Company’s performance are listed in the table below, each of which is described in more detail in the section entitled “CD&A-Performance Metrics and Targets.”
| Financial Performance Measures | ||